draw = ImageDraw.Draw(img), then call shape methods with a box (x0, y0, x1, y1) or a list of
points. Both corners of the box are included. Use fill= for the inside, outline= and
width= for the edge. For smooth curves, draw at 3–4× and shrink with Image.LANCZOS.
Every shape method at a glance
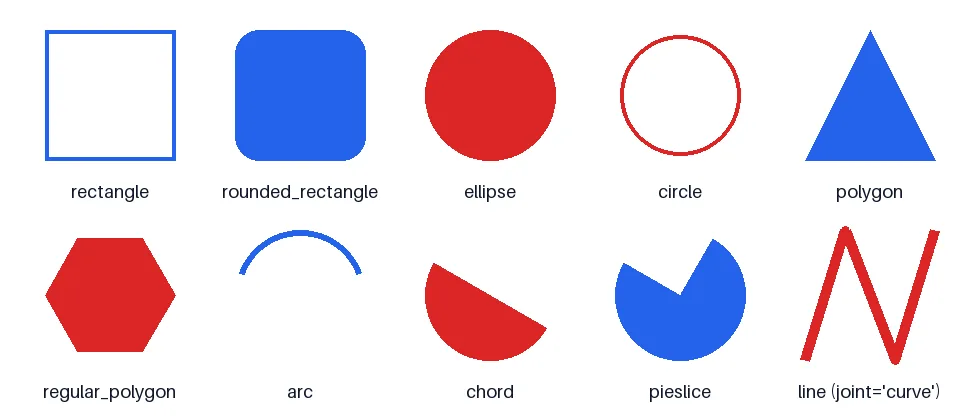
circle() needs Pillow 10.4 or newer.For a task-by-task walkthrough (coordinates, outline width, labelled boxes), see drawing shapes.
from PIL import Image, ImageDraw, ImageFont

img = Image.new("RGB", (960, 420), "white")
d = ImageDraw.Draw(img)
font = ImageFont.load_default(size=18)
blue, red = "#2563eb", "#dc2626"

shapes = [
    ("rectangle", lambda b: d.rectangle(b, outline=blue, width=4)),
    ("rounded_rectangle", lambda b: d.rounded_rectangle(b, radius=24, fill=blue)),
    ("ellipse", lambda b: d.ellipse(b, fill=red)),
    ("circle", lambda b: d.circle(((b[0] + b[2]) / 2, (b[1] + b[3]) / 2), 60, outline=red, width=4)),
    ("polygon", lambda b: d.polygon([(b[0], b[3]), ((b[0] + b[2]) / 2, b[1]), (b[2], b[3])], fill=blue)),
    ("regular_polygon", lambda b: d.regular_polygon(((b[0] + b[2]) / 2, (b[1] + b[3]) / 2, 65), 6, fill=red)),
    ("arc", lambda b: d.arc(b, start=200, end=340, fill=blue, width=6)),
    ("chord", lambda b: d.chord(b, start=30, end=210, fill=red)),
    ("pieslice", lambda b: d.pieslice(b, start=-60, end=210, fill=blue)),
    ("line (joint='curve')", lambda b: d.line([(b[0], b[3]), (b[0] + 40, b[1]), (b[2] - 40, b[3]), (b[2], b[1])],
                                               fill=red, width=10, joint="curve")),
]
for i, (name, draw_it) in enumerate(shapes):
    col, row = i % 5, i // 5
    x, y = 30 + col * 190, 30 + row * 200
    draw_it((x + 15, y, x + 145, y + 130))
    d.text((x + 80, y + 150), name, font=font, fill="#0f172a", anchor="ma")
img.save("shapes.png")| Method | Takes | Fill / outline |
|---|---|---|
rectangle, rounded_rectangle | box; radius= | both |
ellipse, circle | box; centre and radius | both |
polygon, regular_polygon | points; (centre x, centre y, radius) and sides | both |
arc | box, start, end (degrees, clockwise from 3 o'clock) | line only |
chord, pieslice | box, start, end | both |
line | points; width, joint="curve" | line only |
point | points | single pixels |
text, multiline_text | position, string, font, anchor | see adding text |
Text: text, multiline_text, textbbox, textlength
Text drawing lives on the same object as shapes. Measure before you draw: textlength() is the advance width,
textbbox() the exact ink box at a position. Since Pillow 10.1 you can pass font_size= instead of loading
a font, which uses the built-in scalable font:
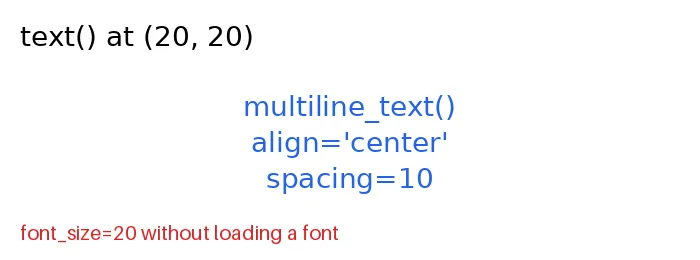
from PIL import Image, ImageDraw, ImageFont

img = Image.new("RGB", (700, 260), "white")
d = ImageDraw.Draw(img)
font = ImageFont.truetype("DejaVuSans.ttf", 28)

d.text((20, 20), "text() at (20, 20)", font=font, fill="black")
print("textlength:", d.textlength("text() at (20, 20)", font=font))
print("textbbox:  ", d.textbbox((20, 20), "text() at (20, 20)", font=font))

lines = "multiline_text()\nalign='center'\nspacing=10"
d.multiline_text((350, 90), lines, font=font, fill="#2563eb", align="center", spacing=10, anchor="ma")
print("multiline_textbbox:", d.multiline_textbbox((350, 90), lines, font=font, align="center", spacing=10, anchor="ma"))

d.text((20, 220), "font_size=20 without loading a font", font_size=20, fill="#dc2626")
img.save("text_methods.png")textlength: 234.0
textbbox: (20, 25, 254, 50)
multiline_textbbox: (243.0, 95, 456.0, 194)Fonts, anchors, wrapping, outlines and non-Latin scripts are covered in depth in adding text to images and the ImageFont reference.
Outlines grow inwards
The box is inclusive on all four sides, and a thick width is drawn inside it. A 5 px outline on the
box (10, 10, 50, 50) covers pixels 10–14 and leaves the outer size unchanged:
from PIL import Image, ImageDraw

img = Image.new("RGB", (60, 60), "white")
ImageDraw.Draw(img).rectangle((10, 10, 50, 50), outline="black", width=5)

for xy in [(9, 9), (10, 10), (14, 14), (15, 15), (50, 50), (51, 51)]:
print(xy, "black" if img.getpixel(xy) == (0, 0, 0) else "white")(9, 9) white
(10, 10) black
(14, 14) black
(15, 15) white
(50, 50) black
(51, 51) whiteSo a 100×100 image needs the box (0, 0, 99, 99) for a border around the edge; (0, 0, 100, 100)
runs one pixel off the right and bottom.
Smooth (anti-aliased) edges
ImageDraw does not anti-alias shapes, so curves and diagonals look jagged. Supersampling fixes it: draw at a multiple of the
size and shrink with Image.LANCZOS. Zoomed in on the same edge:
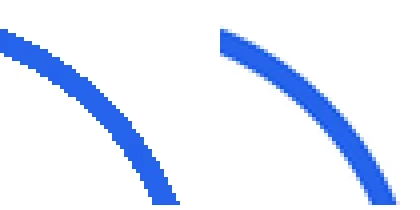
from PIL import Image, ImageDraw

SCALE = 4
size = (200, 200)

# Direct: ImageDraw shapes have hard, aliased edges.
plain = Image.new("RGB", size, "white")
ImageDraw.Draw(plain).ellipse((20, 20, 180, 180), outline="#2563eb", width=6)

# Supersampled: draw 4x larger, then shrink with a good filter.
big = Image.new("RGB", (size[0] * SCALE, size[1] * SCALE), "white")
ImageDraw.Draw(big).ellipse((20 * SCALE, 20 * SCALE, 180 * SCALE, 180 * SCALE),
                            outline="#2563eb", width=6 * SCALE)
smooth = big.resize(size, Image.LANCZOS)

# Zoom in on the edge so the difference is visible.
crop = (130, 20, 180, 70)
out = Image.new("RGB", (420, 210), "white")
out.paste(plain.crop(crop).resize((200, 200), Image.NEAREST), (0, 5))
out.paste(smooth.crop(crop).resize((200, 200), Image.NEAREST), (220, 5))
out.save("antialias_zoom.png")It costs time, because the drawing and the resize both handle scale² as many pixels. Measured on a 600×400 image with 40 circles and 40 lines:
import time
from PIL import Image, ImageDraw

def draw_badge(scale):
    big = Image.new("RGB", (600 * scale, 400 * scale), "white")
    d = ImageDraw.Draw(big)
    for i in range(40):                                        # 40 circles and lines, like a chart or badge
        x = (i * 37 % 560) * scale
        d.ellipse((x, 40 * scale, x + 80 * scale, 120 * scale), outline="#2563eb", width=3 * scale)
        d.line((0, (i * 9) * scale, 600 * scale, (400 - i * 9) * scale), fill="#dc2626", width=2 * scale)
    return big.resize((600, 400), Image.LANCZOS) if scale > 1 else big

for scale in [1, 2, 3, 4, 8]:
    runs = []
    for _ in range(3):
        t = time.perf_counter()
        draw_badge(scale)
        runs.append((time.perf_counter() - t) * 1000)
print(f"{scale}x supersampling {min(runs):7.1f} ms")Curves: Bezier shapes with Outline
There is no bezier() method, but ImageDraw.Outline builds a path from move,
line and cubic curve segments, and shape() fills it:
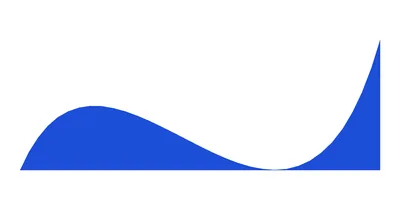
from PIL import Image, ImageDraw

SCALE = 4                                            # supersample for smooth edges
img = Image.new("RGB", (400 * SCALE, 200 * SCALE), "white")
d = ImageDraw.Draw(img)

outline = ImageDraw.Outline()
outline.move(20 * SCALE, 170 * SCALE)
outline.curve(110 * SCALE, -40 * SCALE, 290 * SCALE, 360 * SCALE, 380 * SCALE, 40 * SCALE)   # cubic Bezier
outline.line(380 * SCALE, 170 * SCALE)
outline.close()
d.shape(outline, fill="#bfdbfe", outline="#1d4ed8")

img = img.resize((400, 200), Image.LANCZOS)
img.save("bezier.png")
print(img.size)curve(x1, y1, x2, y2, x3, y3) goes from the current point to (x3, y3) with two control points. For a curved
line rather than a filled shape, sample the curve into points and pass them to line(..., joint="curve").
Rounded corners and rotated polygons
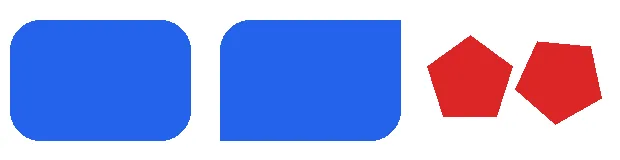
from PIL import Image, ImageDraw

img = Image.new("RGB", (620, 160), "white")
d = ImageDraw.Draw(img)
d.rounded_rectangle((10, 20, 190, 140), radius=30, fill="#2563eb")
d.rounded_rectangle((220, 20, 400, 140), radius=30, fill="#2563eb", corners=(True, False, True, False))   # TL, TR, BR, BL
for i, rot in enumerate((0, 30)):
    d.regular_polygon((470 + i * 90, 80, 45), n_sides=5, rotation=rot, fill="#dc2626")
img.save("corners.png")
print("corners=(True, False, True, False) rounds the top-left and bottom-right only")corners=(True, False, True, False) rounds the top-left and bottom-right onlyFlood fill
ImageDraw.floodfill() is a module function, not a method: it fills the connected area around a point with a colour,
like a paint bucket. thresh is how different a neighbouring pixel may be and still be filled; border
fills up to a specific colour instead.
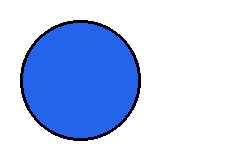
from PIL import Image, ImageDraw

img = Image.new("RGB", (240, 160), "white")
d = ImageDraw.Draw(img)
d.ellipse((20, 20, 140, 140), outline="black", width=3)
ImageDraw.floodfill(img, (80, 80), (37, 99, 235))           # fills the disc, stops at the outline
print("inside the circle:", img.getpixel((80, 80)), " outside:", img.getpixel((5, 5)))
img.save("floodfill.png")

# thresh: how far a neighbour's colour may be from the start pixel and still be filled
ramp = Image.new("RGB", (256, 20))
ramp.putdata([(x, x, x) for y in range(20) for x in range(256)])  # brightness = x
for t in (0, 40, 120):
    im = ramp.copy()
    ImageDraw.floodfill(im, (0, 10), (255, 0, 0), thresh=t)
    filled = sum(1 for px in im.get_flattened_data() if px == (255, 0, 0))
print(f"thresh={t:<3} filled {filled // 20} of 256 columns")inside the circle: (37, 99, 235) outside: (255, 255, 255)
thresh=0 filled 1 of 256 columns
thresh=40 filled 14 of 256 columns
thresh=120 filled 41 of 256 columnsThe ramp shows a detail that surprises people: thresh is compared with the sum of the differences in all
channels (we checked the Pillow source), so on an RGB image thresh=40 allows only about 13 levels per channel, and
you need roughly three times the value you would expect. On a greyscale image it is the plain difference.
Flood fill is also the cleanest way to remove a white background around a subject; see making a background transparent.
Single pixels and bitmaps
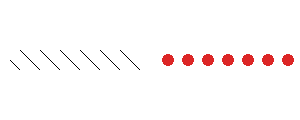
from PIL import Image, ImageDraw

img = Image.new("RGB", (300, 120), "white")
d = ImageDraw.Draw(img)
d.point([(x, 60 + (x % 20) - 10) for x in range(10, 140)], fill="black")      # single pixels

mask = Image.new("1", (16, 16), 0)                                             # a bitmap: 1 = paint
ImageDraw.Draw(mask).ellipse((2, 2, 13, 13), fill=1)
for x in range(160, 290, 20):
    d.bitmap((x, 52), mask, fill="#dc2626")                                    # stamps the colour where the mask is 1
print("bitmap painted:", img.getpixel((168, 60)), " left white:", img.getpixel((161, 53)))
img.save("points.png")bitmap painted: (220, 38, 38) left white: (255, 255, 255)point() takes any number of coordinates at once, which is much faster than calling it per pixel.
bitmap() paints the fill colour wherever a 1 or L mask is set.
Translucent fills
An alpha value in fill is ignored on an RGB image unless the drawing context is created with mode
"RGBA", which blends each shape onto what is already there:
from PIL import Image, ImageDraw

base = Image.new("RGB", (300, 120), "#2563eb")

# Default: the alpha value is ignored on an RGB image; the colour is written as-is.
a = base.copy()
ImageDraw.Draw(a).rectangle((20, 20, 280, 100), fill=(255, 255, 255, 128))
print("Draw(img):        ", a.getpixel((150, 60)))

# Draw(img, "RGBA"): the fill is blended onto the existing pixels.
b = base.copy()
ImageDraw.Draw(b, "RGBA").rectangle((20, 20, 280, 100), fill=(255, 255, 255, 128))
print('Draw(img, "RGBA"):', b.getpixel((150, 60)))Draw(img): (255, 255, 255)
Draw(img, "RGBA"): (146, 177, 245)Labelled bounding boxes
The usual way to show object-detection output: a box, then a filled label sized with textbbox():
from PIL import Image, ImageDraw, ImageFont

img = Image.open("photo.jpg")
draw = ImageDraw.Draw(img)
font = ImageFont.truetype("DejaVuSans-Bold.ttf", 22)

detections = [((660, 462, 704, 772), "rocket", 0.97), ((872, 536, 958, 742), "water tower", 0.91),
              ((888, 700, 1068, 852), "tank", 0.86)]
for (x0, y0, x1, y1), label, score in detections:
    draw.rectangle((x0, y0, x1, y1), outline="#facc15", width=4)
    text = f"{label} {score:.2f}"
    l, t, r, b = draw.textbbox((x0, y0), text, font=font, anchor="lb")
    draw.rectangle((l - 6, t - 6, r + 6, b + 4), fill="#facc15")
    draw.text((x0, y0), text, font=font, fill="black", anchor="lb")
img.save("detections.jpg", quality=88)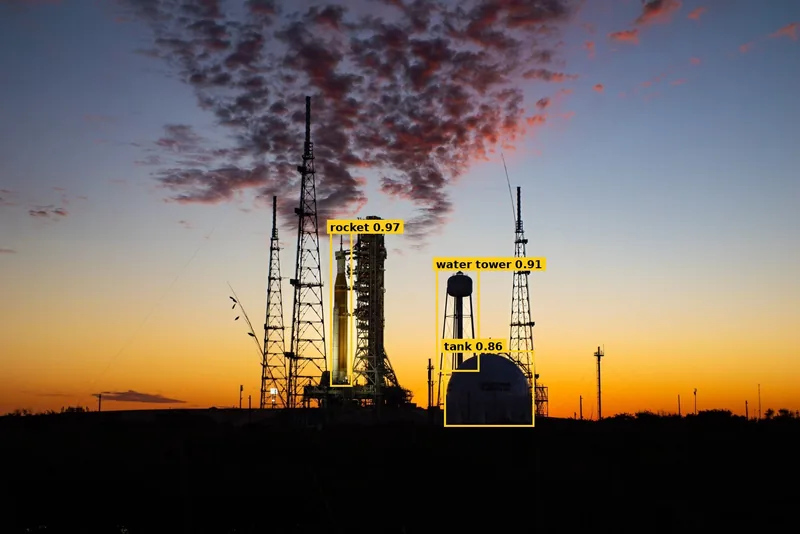
Round avatar with a mask
from PIL import Image, ImageDraw, ImageOps

photo = ImageOps.fit(Image.open("photo.jpg"), (400, 400))      # square crop

mask = Image.new("L", photo.size, 0)                          # 0 = transparent
ImageDraw.Draw(mask).ellipse((0, 0, 399, 399), fill=255)       # 255 = opaque

avatar = photo.convert("RGBA")
avatar.putalpha(mask)
avatar.save("avatar.png")                                      # PNG keeps transparency
print(avatar.mode, avatar.size)RGBA (400, 400)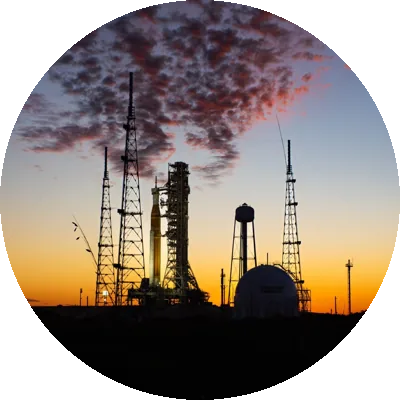
All ImageDraw methods in Pillow 13.0.0
Generated from the installed Pillow when this page was built. The build fails if Pillow adds a method we have not described.
Module functions 3
| Name and signature | What it does |
|---|---|
Draw(im, mode=None) | Creates the drawing object for an image. Pass "RGBA" as the mode to blend translucent colours onto an RGB image. Example |
floodfill(image, xy, value, border=None, thresh=0) | Fills the connected area around a point, like a paint bucket; thresh sets the tolerance, border fills up to a colour. Example |
getdraw(im=None) | Returns a drawing object from the older ImageDraw2 API and that module. Kept for old code; use Draw(). |
Drawing methods (on the object Draw() returns) 19
| Name and signature | What it does |
|---|---|
arc(xy, start, end, fill=None, width=1) | An outline of part of an ellipse; angles in degrees, clockwise from 3 o'clock. |
bitmap(xy, bitmap, fill=None) | Paints the fill colour where a mask image is set. Example |
chord(xy, start, end, fill=None, outline=None, width=1) | Part of an ellipse closed by a straight line; can be filled. |
circle(xy, radius, fill=None, outline=None, width=1) | A circle from a centre point and radius (Pillow 10.4+). |
ellipse(xy, fill=None, outline=None, width=1) | An ellipse or circle inside a bounding box. |
getfont() | Returns the font used when text() gets no font. |
line(xy, fill=None, width=1, joint=None) | A line through a list of points; joint="curve" rounds the corners of thick lines. |
multiline_text(xy, text, fill=None, font=None, anchor=None, spacing=4, align='left', direction=None, features=None, language=None, stroke_width=0, stroke_fill=None, embedded_color=False, *, font_size=None) | Draws text containing line breaks, with spacing and align. Example |
multiline_textbbox(xy, text, font=None, anchor=None, spacing=4, align='left', direction=None, features=None, language=None, stroke_width=0, embedded_color=False, *, font_size=None) | The ink bounding box of multi-line text at a position. |
pieslice(xy, start, end, fill=None, outline=None, width=1) | A filled wedge of an ellipse, like a pie-chart slice. |
point(xy, fill=None) | Single pixels at a list of coordinates. Example |
polygon(xy, fill=None, outline=None, width=1) | A closed shape through a list of points. |
rectangle(xy, fill=None, outline=None, width=1) | A rectangle; both corners are included, and thick outlines grow inwards. Example |
regular_polygon(bounding_circle, n_sides, rotation=0, fill=None, outline=None, width=1) | A regular polygon from a bounding circle, number of sides and rotation. Example |
rounded_rectangle(xy, radius=0, fill=None, outline=None, width=1, *, corners=None) | A rectangle with rounded corners; corners picks which ones are rounded. Example |
shape(shape, fill=None, outline=None) | Fills and outlines an Outline path, which can contain Bezier curves. Example |
text(xy, text, fill=None, font=None, anchor=None, spacing=4, align='left', direction=None, features=None, language=None, stroke_width=0, stroke_fill=None, embedded_color=False, *args, **kwargs) | Draws a line of text; anchor sets which point of the text sits at xy. Example |
textbbox(xy, text, font=None, anchor=None, spacing=4, align='left', direction=None, features=None, language=None, stroke_width=0, embedded_color=False, *, font_size=None) | The ink bounding box of text at a position, with the same arguments as text(). |
textlength(text, font=None, direction=None, features=None, language=None, embedded_color=False, *, font_size=None) | The advance width of text in pixels, for laying out text side by side. |
Outline (paths for shape()) 5
| Name and signature | What it does |
|---|---|
close(...) | Closes the path back to its start point. |
curve(...) | A cubic Bezier segment to (x3, y3) through two control points. |
line(...) | A straight segment to a point. |
move(...) | Starts a new subpath at a point. |
transform(...) | Applies an affine matrix (6 numbers) to every point of the path. |
Sources
What this page shows comes from running its code with Pillow 13.0.0. The API details and version history were checked against these primary sources:
Related
The outputs and images on this page are the real results of running every example with Pillow 13.0.0 on Python 3.13 (Linux) on 2026-10-29. Every example is also re-run automatically on macOS (Darwin 25.6.0, Pillow 12.3.0), Linux (Linux 6.17.0-1022-azure, Pillow 12.3.0), Windows (Windows 2025Server, Pillow 12.3.0); the line under each example shows the result per operating system. The DejaVu Sans font files sit next to each script so font examples behave the same everywhere. Sample photos: NASA/Sam Lott, public domain. Spotted something wrong? Tell us.