draw = ImageDraw.Draw(img), then draw.rectangle((x0, y0, x1, y1), outline="red", width=3),
draw.ellipse(...) with the circle's bounding box, draw.line([(x, y), ...], width=...). For
semi-transparent fills, draw on a transparent RGBA layer and Image.alpha_composite() it onto the image.
The basic shapes
from PIL import Image, ImageDraw

img = Image.open("photo.jpg")
draw = ImageDraw.Draw(img)                                   # draws on img itself

draw.rectangle((640, 420, 830, 820), outline="yellow", width=6)          # box around the rocket
draw.ellipse((890, 530, 950, 590), outline="#22d3ee", width=5)           # circle on the water tower
draw.line((80, 1000, 600, 760), fill="white", width=8)
draw.polygon([(1200, 300), (1300, 480), (1100, 480)], fill=(239, 68, 68), outline="white")
draw.rounded_rectangle((1150, 900, 1550, 1020), radius=30, fill=(15, 23, 42))
draw.text((1350, 960), "Launch Pad 39B", fill="white", anchor="mm", font_size=36)
img.save("shapes.jpg")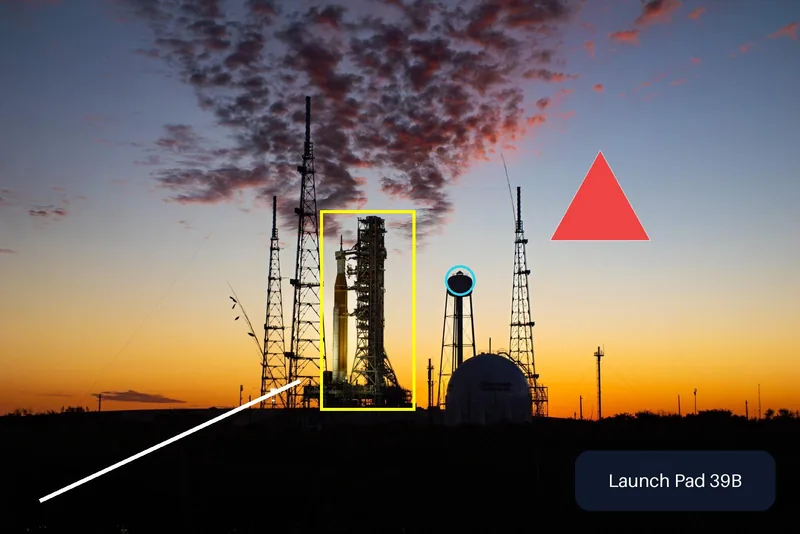
Every shape takes a bounding box or a list of points in pixels from the top-left corner. Colours can be names, hex strings
or tuples. A circle is an ellipse whose box is square: centre (cx, cy) and radius r give
(cx - r, cy - r, cx + r, cy + r), or use draw.circle((cx, cy), r).
How the box coordinates work
import numpy as np
from PIL import Image, ImageDraw

img = Image.new("L", (30, 30), 0)
ImageDraw.Draw(img).rectangle((2, 2, 9, 9), fill=255)
xs = np.nonzero(np.asarray(img))[1]
print("rectangle((2, 2, 9, 9)) covers x =", xs.min(), "to", xs.max(), "->", xs.max() - xs.min() + 1, "pixels wide")

img = Image.new("L", (30, 30), 0)
ImageDraw.Draw(img).rectangle((5, 5, 24, 24), outline=255, width=4)
print("outline width=4, row 12 lit at x =", np.nonzero(np.asarray(img)[12])[0].tolist())

try:
    ImageDraw.Draw(img).rectangle((24, 24, 5, 5), fill=255)
except ValueError as e:
print("reversed box: ValueError:", e)rectangle((2, 2, 9, 9)) covers x = 2 to 9 -> 8 pixels wide
outline width=4, row 12 lit at x = [5, 6, 7, 8, 21, 22, 23, 24]
reversed box: ValueError: x1 must be greater than or equal to x0Unlike crop(), drawing boxes are inclusive: both the first and last pixel are painted, so
(2, 2, 9, 9) is 8 pixels wide, not 7. An outline's width grows inwards from the box edge, so the box's
outer size never changes with the line width. And the first corner must be the top-left one.
Semi-transparent fills
The alpha value in a colour does three different things depending on the image:
from PIL import Image, ImageDraw

blue = (0, 0, 255)
red_half = (255, 0, 0, 128)                                     # 50% transparent red

rgb = Image.new("RGB", (10, 10), blue)
ImageDraw.Draw(rgb).rectangle((0, 0, 9, 9), fill=red_half)
print("RGB image:                ", rgb.getpixel((5, 5)))       # alpha ignored: solid red

rgb = Image.new("RGB", (10, 10), blue)
ImageDraw.Draw(rgb, "RGBA").rectangle((0, 0, 9, 9), fill=red_half)
print("RGB image, Draw(.., RGBA):", rgb.getpixel((5, 5)))       # blended

rgba = Image.new("RGBA", (10, 10), blue + (255,))
ImageDraw.Draw(rgba).rectangle((0, 0, 9, 9), fill=red_half)
print("RGBA image: ", rgba.getpixel((5, 5))) # replaced: now see-through!RGB image: (255, 0, 0)
RGB image, Draw(.., RGBA): (128, 0, 127)
RGBA image: (255, 0, 0, 128)On an RGB image the alpha is silently ignored. ImageDraw.Draw(img, "RGBA") blends instead. On an RGBA image,
drawing replaces pixels, alpha included, so a 50% fill punches a half-transparent hole into an opaque image. The
reliable pattern is a separate transparent layer, composited on top:
from PIL import Image, ImageDraw

photo = Image.open("photo.jpg").convert("RGBA")
overlay = Image.new("RGBA", photo.size, (0, 0, 0, 0))           # transparent layer to draw on
d = ImageDraw.Draw(overlay)
d.rectangle((640, 420, 830, 820), fill=(250, 204, 21, 90), outline=(250, 204, 21, 255), width=5)
d.ellipse((870, 520, 970, 620), fill=(34, 211, 238, 90), outline=(34, 211, 238, 255), width=5)

result = Image.alpha_composite(photo, overlay).convert("RGB")
result.save("highlight.jpg")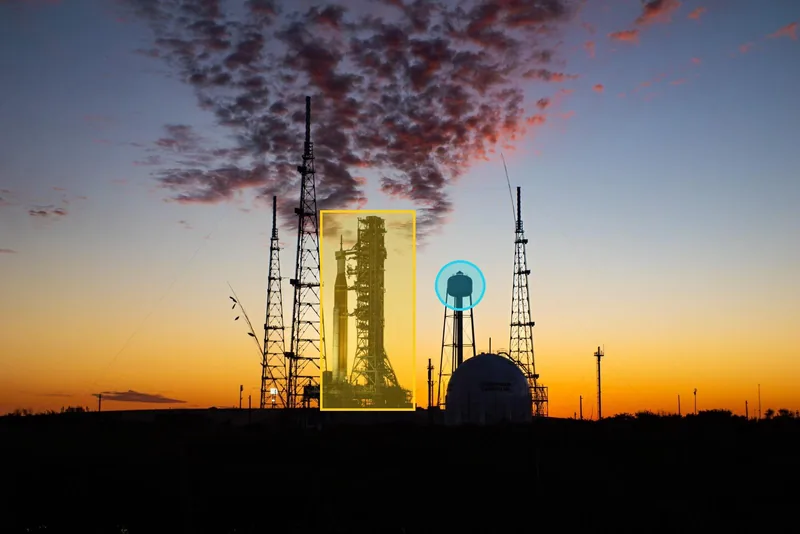
Smooth (anti-aliased) circles
ImageDraw does not anti-alias shapes, so curves and diagonals have jagged edges. Draw at 4× size and
shrink:
from PIL import Image, ImageDraw

SCALE = 4
size = 120

jagged = Image.new("RGB", (size, size), "white")
ImageDraw.Draw(jagged).ellipse((10, 10, size - 11, size - 11), outline="black", width=3)

big = Image.new("RGB", (size * SCALE, size * SCALE), "white")    # draw 4x larger...
ImageDraw.Draw(big).ellipse((10 * SCALE, 10 * SCALE, (size - 11) * SCALE, (size - 11) * SCALE),
                            outline="black", width=3 * SCALE)
smooth = big.resize((size, size), Image.LANCZOS)                 # ...then shrink: smooth edges

sheet = Image.new("RGB", (size * 2 + 10, size), "white")
sheet.paste(jagged, (0, 0))
sheet.paste(smooth, (size + 10, 0))
sheet.resize((sheet.width * 3, sheet.height * 3), Image.NEAREST).save("aa.png")   # enlarged to show the pixels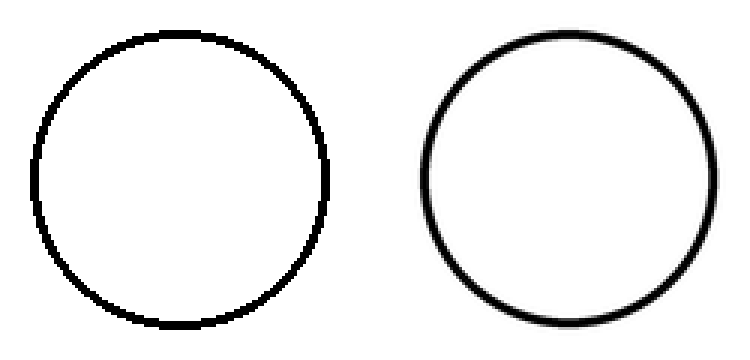
Text is the exception: it is anti-aliased already.
Thick lines and corners
from PIL import Image, ImageDraw

img = Image.new("RGB", (620, 200), "white")
d = ImageDraw.Draw(img)
points = [(30, 160), (120, 40), (210, 160), (300, 40)]
d.line(points, fill="#2563eb", width=24)                                  # default joints: notches at corners
d.line([(x + 300, y) for x, y in points], fill="#2563eb", width=24, joint="curve")
img.save("joints.png")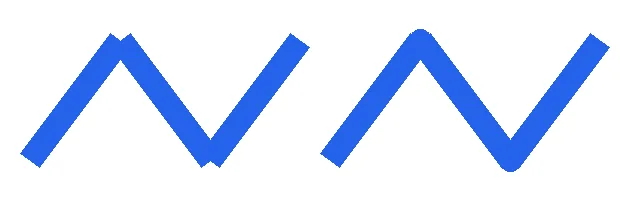
joint="curve".A labelled box (as in object detection)
textbbox() measures the label before drawing, so the background tag fits the text exactly:
from PIL import Image, ImageDraw

img = Image.open("photo.jpg")
d = ImageDraw.Draw(img)
box, label = (640, 420, 830, 820), "rocket 0.97"

d.rectangle(box, outline=(250, 204, 21), width=5)
left, top, right, bottom = d.textbbox((box[0], box[1]), label, font_size=28, anchor="lb")
d.rectangle((left - 4, top - 6, right + 6, bottom), fill=(250, 204, 21))        # tag sized to the text
d.text((box[0], box[1]), label, fill="black", font_size=28, anchor="lb")
img.crop((560, 340, 960, 860)).save("label.jpg")
print("text box:", (left, top, right, bottom))text box: (640, 400, 782, 420)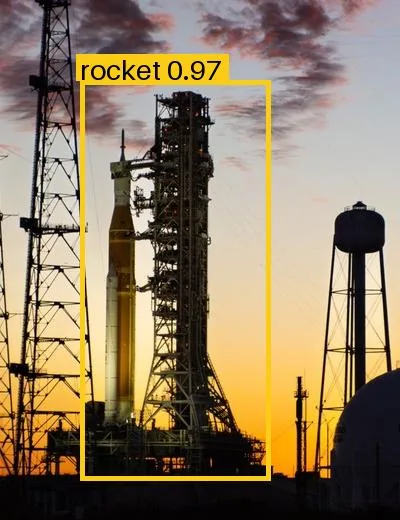
The ImageDraw reference lists every drawing method; the text guide covers fonts, centring and wrapping.
Related
The outputs and images on this page are the real results of running every example with Pillow 12.3.0 on Python 3.13 (Linux) on 2026-10-15. Every example is also re-run automatically on macOS (Darwin 25.6.0, Pillow 12.3.0), Linux (Linux 6.17.0-1022-azure, Pillow 12.3.0), Windows (Windows 2025Server, Pillow 12.3.0); the line under each example shows the result per operating system. The DejaVu Sans font files sit next to each script so font examples behave the same everywhere. Sample photos: NASA/Sam Lott, public domain. Spotted something wrong? Tell us.