Pillow ImageDraw Module
Independent quick-reference. Canonical source: official ImageDraw module documentation.
ImageDraw draws shapes and text directly onto a Pillow image: boxes and labels on detection results, charts and badges, watermarks, social cards, or simple generated graphics. You create one Draw object per image and call its methods; every call changes the image in place.
ImageDraw.Draw()
Creates a drawing object that can be used to draw on the given image.
| Parameter | Type | Description |
|---|---|---|
im | Image | The image to draw in. Note: image is modified in place. |
mode | str | Mode to use for drawing. Defaults to the image mode. |
Drawing Methods: rectangle, ellipse, line & polygon
All methods accept fill (interior colour) and/or outline (border colour). Colours can be strings like "red", hex "#ff0000", or RGBA tuples (255, 0, 0, 128).
| Method | Signature | Description |
|---|---|---|
arc() | arc(xy, start, end, fill=None, width=1) | Draw an arc between start and end angles (degrees, clockwise from 3 o'clock). |
bitmap() | bitmap(xy, bitmap, fill=None) | Draw given bitmap over image at given offset, with fill for set pixels. |
chord() | chord(xy, start, end, fill=None, outline=None, width=1) | Same as arc but connects endpoints with a straight line. |
ellipse() | ellipse(xy, fill=None, outline=None, width=1) | Draw an ellipse inside a bounding box. Pass a 4-tuple [x0,y0,x1,y1]. |
circle() | circle(xy, radius, fill=None, outline=None, width=1) | Draw a circle. xy is the center point. |
line() | line(xy, fill=None, width=1, joint=None) | Draw a line between all points in xy. joint can be "curve" for round joins. |
pieslice() | pieslice(xy, start, end, fill=None, outline=None, width=1) | Same as arc but draws a pie slice from center to endpoints. |
point() | point(xy, fill=None) | Draw individual pixels. |
polygon() | polygon(xy, fill=None, outline=None, width=1) | Draw a polygon from a list of points [(x0,y0), (x1,y1), ...]. |
regular_polygon() | regular_polygon(bounding_circle, n_sides, rotation=0, fill=None, outline=None, width=1) | Draw a regular polygon with n_sides sides inscribed within a circle. |
rectangle() | rectangle(xy, fill=None, outline=None, width=1) | Draw a rectangle. xy is [x0,y0,x1,y1] or [(x0,y0),(x1,y1)]. |
rounded_rectangle() | rounded_rectangle(xy, radius=0, fill=None, outline=None, width=1) | Draw a rectangle with rounded corners. |
Text Methods: text(), textbbox() & textlength()
| Method | Signature | Description |
|---|---|---|
text() | text(xy, text, fill=None, font=None, anchor=None, spacing=4, align="left", direction=None, features=None, language=None, stroke_width=0, stroke_fill=None, embedded_color=False) | Draw text at position xy. |
multiline_text() | multiline_text(xy, text, fill=None, font=None, anchor=None, spacing=4, align="left", direction=None, features=None, language=None, stroke_width=0, stroke_fill=None, embedded_color=False) | Draw multi-line text, splitting on \n. |
textlength() | textlength(text, font=None, direction=None, features=None, language=None, embedded_color=False) | Returns the length of a string given the current font, in pixels. |
textbbox() | textbbox(xy, text, font=None, anchor=None, spacing=4, align="left", direction=None, features=None, language=None, stroke_width=0, embedded_color=False) | Returns bounding box (left, top, right, bottom) of the given text. Useful for centering. |
Flood Fill
The ImageDraw.floodfill() function fills a bounded region of an image with a colour. Note: this is a function, not a Draw method.
Full Example: Annotated Image
Tested examples
Everything in this section was run with Pillow 12.3.0; the images are the real output. Sample photos: NASA/Sam Lott, public domain.
Every shape method at a glance
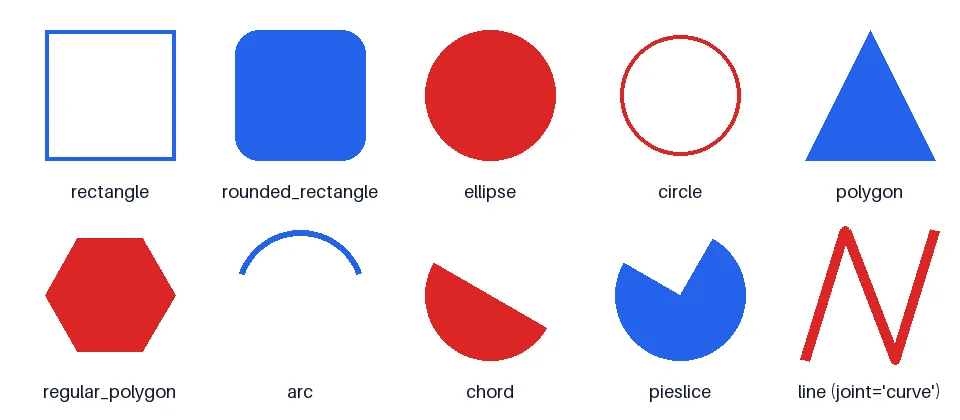
circle() needs Pillow 10.4 or newer.from PIL import Image, ImageDraw, ImageFont
img = Image.new("RGB", (960, 420), "white")
d = ImageDraw.Draw(img)
font = ImageFont.load_default(size=18)
blue, red = "#2563eb", "#dc2626"
shapes = [
("rectangle", lambda b: d.rectangle(b, outline=blue, width=4)),
("rounded_rectangle", lambda b: d.rounded_rectangle(b, radius=24, fill=blue)),
("ellipse", lambda b: d.ellipse(b, fill=red)),
("circle", lambda b: d.circle(((b[0] + b[2]) / 2, (b[1] + b[3]) / 2), 60, outline=red, width=4)),
("polygon", lambda b: d.polygon([(b[0], b[3]), ((b[0] + b[2]) / 2, b[1]), (b[2], b[3])], fill=blue)),
("regular_polygon", lambda b: d.regular_polygon(((b[0] + b[2]) / 2, (b[1] + b[3]) / 2, 65), 6, fill=red)),
("arc", lambda b: d.arc(b, start=200, end=340, fill=blue, width=6)),
("chord", lambda b: d.chord(b, start=30, end=210, fill=red)),
("pieslice", lambda b: d.pieslice(b, start=-60, end=210, fill=blue)),
("line (joint='curve')", lambda b: d.line([(b[0], b[3]), (b[0] + 40, b[1]), (b[2] - 40, b[3]), (b[2], b[1])],
fill=red, width=10, joint="curve")),
]
for i, (name, draw_it) in enumerate(shapes):
col, row = i % 5, i // 5
x, y = 30 + col * 190, 30 + row * 200
draw_it((x + 15, y, x + 145, y + 130))
d.text((x + 80, y + 150), name, font=font, fill="#0f172a", anchor="ma")
img.save("shapes.png")Outlines grow inwards
The xy box is inclusive on all four sides, and a thick width is drawn inside it. A 5 px
outline on the box (10, 10, 50, 50) covers pixels 10–14 and leaves the outer size unchanged:
from PIL import Image, ImageDraw

img = Image.new("RGB", (60, 60), "white")
ImageDraw.Draw(img).rectangle((10, 10, 50, 50), outline="black", width=5)

for xy in [(9, 9), (10, 10), (14, 14), (15, 15), (50, 50), (51, 51)]:
print(xy, "black" if img.getpixel(xy) == (0, 0, 0) else "white")(9, 9) white
(10, 10) black
(14, 14) black
(15, 15) white
(50, 50) black
(51, 51) whiteSmooth (anti-aliased) edges
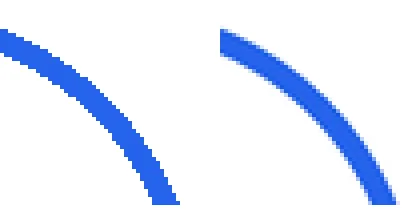
ImageDraw does not anti-alias shapes, so curves and diagonals look jagged. The standard workaround is supersampling:
draw at 4× the size and shrink with Image.LANCZOS. Zoomed in on the same edge:
from PIL import Image, ImageDraw

SCALE = 4
size = (200, 200)

# Direct: ImageDraw shapes have hard, aliased edges.
plain = Image.new("RGB", size, "white")
ImageDraw.Draw(plain).ellipse((20, 20, 180, 180), outline="#2563eb", width=6)

# Supersampled: draw 4x larger, then shrink with a good filter.
big = Image.new("RGB", (size[0] * SCALE, size[1] * SCALE), "white")
ImageDraw.Draw(big).ellipse((20 * SCALE, 20 * SCALE, 180 * SCALE, 180 * SCALE),
                            outline="#2563eb", width=6 * SCALE)
smooth = big.resize(size, Image.LANCZOS)

# Zoom in on the edge so the difference is visible.
crop = (130, 20, 180, 70)
out = Image.new("RGB", (420, 210), "white")
out.paste(plain.crop(crop).resize((200, 200), Image.NEAREST), (0, 5))
out.paste(smooth.crop(crop).resize((200, 200), Image.NEAREST), (220, 5))
out.save("antialias_zoom.png")Translucent fills
An alpha value in fill is ignored on an RGB image unless you create the drawing context with mode
"RGBA", which blends each shape onto what is already there:
from PIL import Image, ImageDraw

base = Image.new("RGB", (300, 120), "#2563eb")

# Default: the alpha value is ignored on an RGB image; the colour is written as-is.
a = base.copy()
ImageDraw.Draw(a).rectangle((20, 20, 280, 100), fill=(255, 255, 255, 128))
print("Draw(img):        ", a.getpixel((150, 60)))

# Draw(img, "RGBA"): the fill is blended onto the existing pixels.
b = base.copy()
ImageDraw.Draw(b, "RGBA").rectangle((20, 20, 280, 100), fill=(255, 255, 255, 128))
print('Draw(img, "RGBA"):', b.getpixel((150, 60)))Draw(img): (255, 255, 255)
Draw(img, "RGBA"): (146, 177, 245)Labelled bounding boxes (object detection output)
from PIL import Image, ImageDraw, ImageFont

img = Image.open("photo.jpg")
draw = ImageDraw.Draw(img)
font = ImageFont.truetype("DejaVuSans-Bold.ttf", 22)

detections = [((660, 462, 704, 772), "rocket", 0.97), ((872, 536, 958, 742), "water tower", 0.91),
              ((888, 700, 1068, 852), "tank", 0.86)]
for (x0, y0, x1, y1), label, score in detections:
    draw.rectangle((x0, y0, x1, y1), outline="#facc15", width=4)
    text = f"{label} {score:.2f}"
    l, t, r, b = draw.textbbox((x0, y0), text, font=font, anchor="lb")
    draw.rectangle((l - 6, t - 6, r + 6, b + 4), fill="#facc15")
    draw.text((x0, y0), text, font=font, fill="black", anchor="lb")
img.save("detections.jpg", quality=88)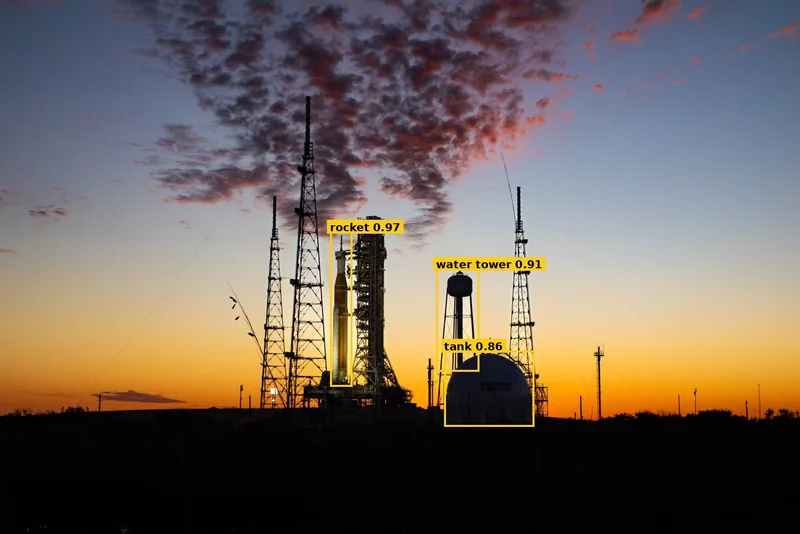
Round avatar with a mask
from PIL import Image, ImageDraw, ImageOps

photo = ImageOps.fit(Image.open("photo.jpg"), (400, 400))      # square crop

mask = Image.new("L", photo.size, 0)                          # 0 = transparent
ImageDraw.Draw(mask).ellipse((0, 0, 399, 399), fill=255)       # 255 = opaque

avatar = photo.convert("RGBA")
avatar.putalpha(mask)
avatar.save("avatar.png")                                      # PNG keeps transparency
print(avatar.mode, avatar.size)RGBA (400, 400)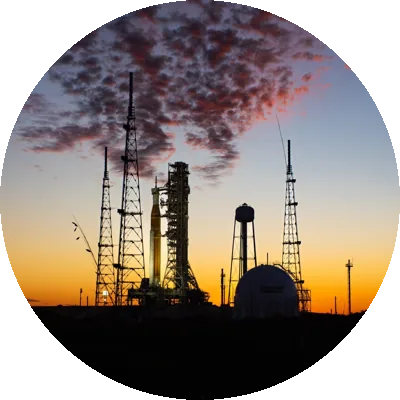
More on text: adding text to images (anchors, wrapping, outlines) and
replacing the removed textsize().